
 ChatGPT
TL;DR
- Budget 8 to 12 percent of revenue, which is what most published HVAC guides land on. A $1.2M company plans around $96,000 a year.
- Weight 60 to 70 percent of that into the six peak months: "ac repair" searches peak in June and July at 2.6 times December, "furnace repair" in December and January at 3 times May.
- Rank channels by cost per booked job. A $55 Local Services Ads lead at a 35 percent close is a $157 job; a $120 search ad lead at 25 percent is a $480 job.
- Maintenance members close around 70 percent on repairs and are the cheapest install leads you will get. Recurring agreements were 55 percent of US HVAC services revenue in 2025.
- Skip shared-lead marketplaces (4 to 8 percent close), radio and print, and cold Facebook in November when ad costs peak.
- The free template below has all nine sections filled in for a sample three-truck company, in Word and PDF.
Most HVAC marketing plans are a list of channels with a budget next to each one. They fail the first week of a heat wave, because nothing in them says what to do when lead cost doubles and the board is full. This one is built the other way around: it starts from the revenue number, works back to how many leads the year needs, and then puts the money where the searches are, month by month. We run this planning for HVAC companies as part of the HVAC marketing work at Skill Mammoth, and we manage Local Services Ads and Google Ads for a flat fee, so we sell two of the channels below. Every cost per lead and close rate in this post is the figure the rest of this blog uses, with its source, and the benchmarks were checked on October 31, 2026.
Download the HVAC marketing plan template
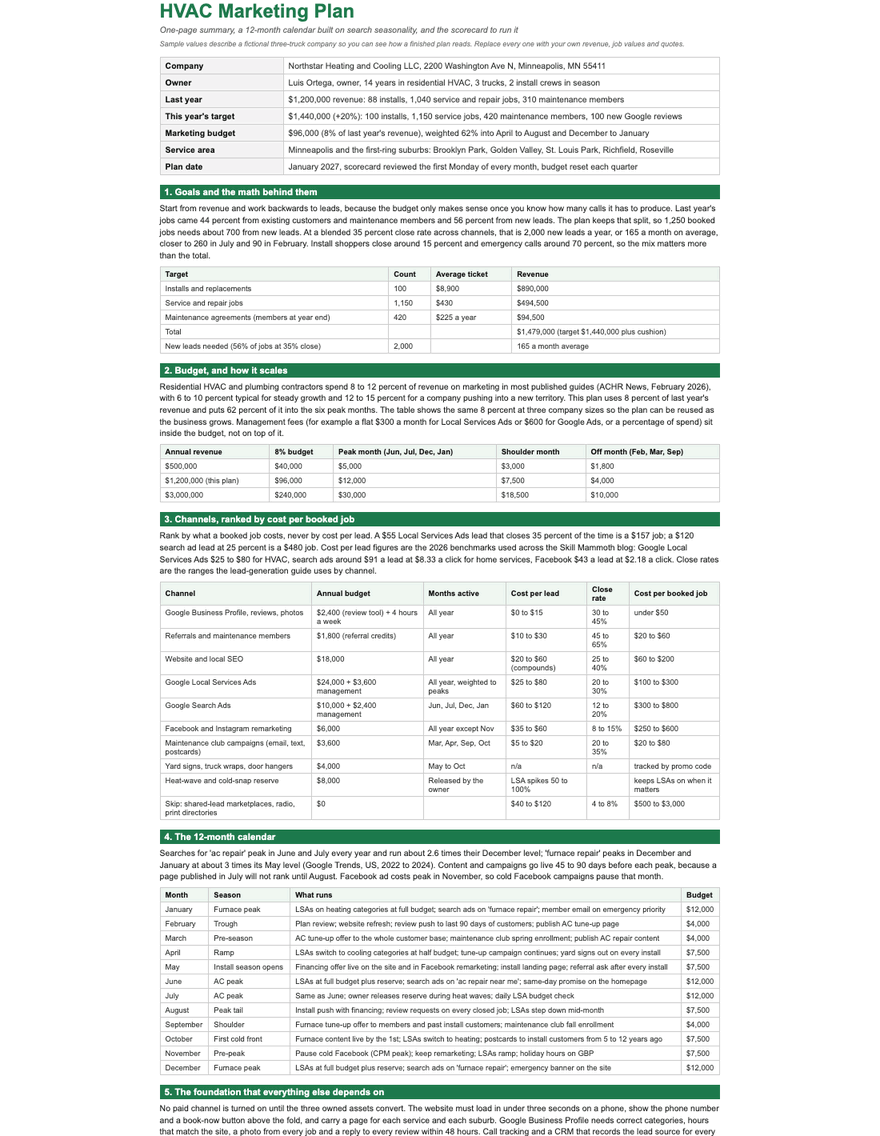
All nine sections written out for a sample three-truck company: the goals math, a budget at three revenue levels, nine channels ranked by cost per booked job, a 12-month calendar tied to search seasonality, the foundation checklist, review and referral targets, maintenance agreement goals, a monthly scorecard, and the four risks with a response for each. Word and PDF, free with your email.
Start with the math, not the channel list
The plan opens with one table: what you need to sell, how many jobs that is, and how many leads those jobs take. The sample company did $1.2M last year on 88 installs, 1,040 service calls and 310 maintenance members, and wants $1.44M this year. At an $8,900 average install and a $430 average service ticket, that is 100 installs and 1,150 service jobs. Housecall Pro's repair report (March 2026, about two million tagged jobs) puts the average HVAC repair ticket at $1,205 in 2025, up from $818 in 2021, so if your service average is higher than the sample, the lead count drops.
Then split the jobs by where they come from. For the sample, 44 percent came from existing customers and members last year, 56 percent from new leads. Keeping that split, 1,250 jobs needs about 700 from new leads. Close rates decide the rest. The HVAC lead generation guide uses these ranges by channel: referrals 45 to 65 percent, Google Business Profile 30 to 45, Local Services Ads 20 to 30, search ads 12 to 20, cold Facebook 8 to 15, shared-lead marketplaces 4 to 8. Blend them by your mix and you land near 35 percent, which makes 700 jobs about 2,000 new leads a year. That is the number the budget has to buy, and it is 165 a month on average but closer to 260 in July and 90 in February.
Two more numbers change the plan more than any channel choice. Emergency calls close around 70 percent; install shoppers around 15. A plan that chases install leads in July is paying for the hardest close at the most expensive time.
How much to spend, and when
Three published guides agree within a few points. ACHR News (February 2026) says most residential HVAC and plumbing contractors spend 8 to 12 percent of revenue on marketing, with 12 to 15 in competitive markets. SBE Odyssey's guide says 6 to 12 percent, 12 to 15 in a growth phase. CI Web Group's 2026 budget guide says 7 to 10 for steady growth, 4 to 8 to hold position, 10 to 15 to expand, and adds the line that matters most: 60 to 70 percent of the annual spend belongs in the peak four to six months. None of the big industry surveys publish a percent-of-revenue figure, so these are agency guides, and they match what we see on client accounts.
| Annual revenue | 8 percent budget | Peak month (Jun, Jul, Dec, Jan) | Shoulder month | Off month (Feb, Mar, Sep) |
|---|---|---|---|---|
| $500,000 | $40,000 | $5,000 | $3,000 | $1,800 |
| $1,200,000 (the sample plan) | $96,000 | $12,000 | $7,500 | $4,000 |
| $3,000,000 | $240,000 | $30,000 | $18,500 | $10,000 |
| Verdict | Pick 8 percent of last year's revenue, put 62 percent of it into the six peak months, and hold back a reserve for heat waves. Management fees live inside the number. | |||
The reserve is the part most plans skip. Local Services Ads cost per lead for HVAC runs $25 to $80 and spikes 50 to 100 percent for a week or two in a heat wave or a cold snap, by our own account data in the LSA cost guide. If the July budget is capped at the planned number, the ads shut off on the three days of the year that pay for the quarter. The sample plan holds $8,000 that only the owner releases.
Nine channels, ranked by cost per booked job
Cost per lead is the number vendors sell on. Cost per booked job is the one that pays the trucks. The cost per lead figures below are the 2026 benchmarks used across this blog: home services search ads at $8.33 a click and $90.92 a lead (WordStream and LocaliQ, in the Google Ads cost guide), Local Services Ads at $25 to $80 for HVAC, Facebook at $2.18 a click and $42.95 a lead for home improvement (LocaliQ 2026, in the Facebook ads cost guide). Multiply by the close rate and the ranking almost writes itself.
| Channel | Sample annual budget | Months active | Cost per lead | Close rate | Cost per booked job |
|---|---|---|---|---|---|
| 1. Google Business Profile, reviews, photos | $2,400 review tool, 4 hours a week | All year | $0 to $15 | 30 to 45% | Under $50 |
| 2. Referrals and maintenance members | $1,800 in credits | All year | $10 to $30 | 45 to 65% | $20 to $60 |
| 3. Website and local SEO | $18,000 | All year | $20 to $60, falling as it compounds | 25 to 40% | $60 to $200 |
| 4. Google Local Services Ads | $24,000 plus $3,600 management | All year, weighted to peaks | $25 to $80 | 20 to 30% | $100 to $300 |
| 5. Google Search Ads | $10,000 plus $2,400 management | Jun, Jul, Dec, Jan | $60 to $120 | 12 to 20% | $300 to $800 |
| 6. Facebook and Instagram remarketing | $6,000 | All year except November | $35 to $60 | 8 to 15% | $250 to $600 |
| 7. Maintenance club campaigns | $3,600 | Mar, Apr, Sep, Oct | $5 to $20 | 20 to 35% | $20 to $80 |
| 8. Yard signs, truck wraps, door hangers | $4,000 | May to October | Tracked by promo code | Varies | |
| 9. Heat-wave and cold-snap reserve | $8,000 | Released by the owner | LSA spikes 50 to 100% | Keeps LSAs on when it matters | |
| Verdict | The first three cost almost nothing per booked job and take months to build. Start them in February. Local Services Ads carry the peaks. Search ads are a peak-only tool at this size. | ||||
Two notes on the paid rows. Skill Mammoth manages Local Services Ads at $300 a month or 15 percent of spend and Google Ads at $600 a month or 12 percent, from the paid ads page, and those fees are inside the sample budget. And the search ads row only earns its place in the four peak months. Outside them, the same dollars in Local Services Ads buy two to three times the booked jobs, which is why the HVAC advertising guide puts LSAs first.
The calendar: when the searches happen
Five years of Google Trends for the US tell the same story every year. Searches for "ac repair" peak in June or July, start climbing in April, and bottom out in December and January. Searches for "furnace repair" peak in December and January and bottom out in May. Inside a clean year like 2024, July "ac repair" ran 2.6 times its December level and January "furnace repair" ran 3 times its May level. Ahrefs puts the monthly volume at 118,939 for "ac repair" in July 2024 against 45,560 in December, and 69,087 for "furnace repair" in January 2024 against 23,062 in May.
The planning rule that follows: content goes live 45 to 90 days before the peak it serves, because a furnace page published in December will not rank until February. The second rule is about Facebook, where cost per thousand impressions peaks in November, so cold campaigns pause that month and remarketing carries on. The HVAC SEO playbook has the page-by-page version.
| Month | Season | What runs | Sample budget |
|---|---|---|---|
| January | Furnace peak | LSAs on heating at full budget; search ads on "furnace repair"; member email on emergency priority | $12,000 |
| February | Trough | Plan review; website refresh; review push to the last 90 days of customers; publish the AC tune-up page | $4,000 |
| March | Pre-season | AC tune-up offer to the whole customer base; maintenance club spring enrollment; AC repair content live | $4,000 |
| April | Ramp | LSAs switch to cooling at half budget; yard signs on every install | $7,500 |
| May | Install season opens | Financing offer on the site and in remarketing; referral ask after every install | $7,500 |
| June and July | AC peak | LSAs at full budget plus reserve; search ads on "ac repair near me"; same-day promise on the homepage; daily budget check | $12,000 each |
| August | Peak tail | Install push with financing; review request on every closed job; LSAs step down mid-month | $7,500 |
| September | Shoulder | Furnace tune-up offer to members and past install customers; fall enrollment | $4,000 |
| October | First cold front | Furnace content live by the 1st; LSAs switch to heating; postcards to install customers from 5 to 12 years ago | $7,500 |
| November | Pre-peak | Pause cold Facebook; keep remarketing; LSAs ramp; holiday hours on the Business Profile | $7,500 |
| December | Furnace peak | LSAs at full budget plus reserve; search ads on "furnace repair"; emergency banner on the site | $12,000 |
Fix the foundation before the first paid dollar
Every channel in the ranking sends people to the same three places, and if those leak, the plan leaks. The website has to load in under three seconds on a phone, show the phone number and a booking button above the fold, and carry a page for every service and every suburb you want to rank in. The Google Business Profile needs the right primary category, hours that match the site, a photo from every job in season and a reply to every review inside 48 hours. Call tracking and a CRM source field on every job are the only way the ranking table can be checked against what actually happened. The HVAC website design guide covers the site side with examples, and a free website audit will tell you in ten minutes whether yours is ready to receive traffic.
Maintenance agreements are the plan inside the plan
By one market estimate (Mordor Intelligence, updated August 2026), recurring service agreements were 55 percent of US HVAC services revenue in 2025. An ACHR News reader poll of 2,364 contractors found 36 percent call agreements a major source of revenue, 32 percent a small one, and 32 percent do not sell them at all. That last third is leaving the cheapest lead source in the business on the table. Members call first, close around 70 percent on repairs because the truck is already trusted, and they are the warmest install leads a company will ever have when the system finally fails.
Housecall Pro's October 2026 price data puts residential maintenance plans at $150 to $300 a year. The sample plan prices at $225 for two visits, priority scheduling and 10 percent off repairs, and targets 110 net new members, enrolled mostly in March and September when the tune-up campaigns run. The technician offers the membership at the end of every tune-up, with a target of one in four joining. The HVAC service agreement template has the contract language.
The monthly scorecard
The plan lives or dies on the first Monday of each month, when eight numbers get filled in from the CRM and the ad accounts. Each has a red line, and the rule is simple: a channel whose cost per booked job sits above its line for two months in a row hands its budget to the channel below it in the ranking.
| Metric | Source | Sample target | Red line |
|---|---|---|---|
| New leads, by channel | CRM | 165 a month average | Under 60 percent of the month's calendar target |
| Booked jobs from new leads | CRM | 58 a month | Blended close under 25 percent |
| Cost per booked job, LSAs | Ads account and CRM | $100 to $300 | Over $300 for two months |
| Cost per booked job, search ads | Ads account and CRM | Under $800 | Over $800 in any peak month |
| Google reviews added | Business Profile | 8 a month | Under 4 |
| Maintenance members, net | CRM | Plus 9 a month | A net loss in any month |
| Website speed and online bookings | Analytics | Under 3 seconds; 30 bookings a month | Over 4 seconds |
| Missed calls | Phone system | Under 5 percent of inbound | Over 10 percent |
Missed calls are on the list because they are the leak nobody budgets for. A plan that buys 165 leads and misses 10 percent of the calls paid for 16 leads that went to the next company on the page. Missed-call text-back is a $50 fix and it belongs in section 5 of the plan, before any paid channel.
Four things to skip
Shared-lead marketplaces first. HomeAdvisor, Angi and Networx leads close at 4 to 8 percent in the ranges this blog uses, because the same lead is sold to three or four companies, which makes a $60 lead a $750 to $1,500 booked job. Radio and print directories second: no tracking, no seasonality control, and the cost per booked job is unknowable. Cold Facebook in November third, when the holiday advertisers push cost per thousand to its yearly high. And search ads outside the four peak months, when the same dollars in Local Services Ads buy more jobs. The HVAC lead channel ranking has the worked math on each.
Want the plan built on your numbers?
A 30-minute call. We pull your last year of jobs by source, run the math from section 1, and send back a filled-in version of this plan with your budget, your calendar and your red lines.
Frequently asked questions
How much should an HVAC company spend on marketing?
Published guides land on 8 to 12 percent of revenue (ACHR News, February 2026), with 6 to 10 percent for steady growth and 12 to 15 percent for a company expanding into new territory. A $1.2M company plans around $96,000 a year, weighted so 60 to 70 percent lands in the peak months.
What is the best marketing channel for HVAC?
By cost per booked job, Google Business Profile with reviews and referrals from maintenance members, both under $60 a job. Among paid channels, Google Local Services Ads at $100 to $300 a booked job beat search ads at $300 to $800, because the lead is cheaper and closes better.
When should HVAC marketing ramp up?
Cooling content and campaigns go live in March and April for the June and July peak; heating content by October 1 for the December and January peak. Searches for "ac repair" peak in June and July at about 2.6 times their December level, and "furnace repair" peaks in December and January at about 3 times its May level.
Should HVAC companies run Google Ads year round?
At a three-truck size, no. Search ads cost $60 to $120 a lead and close 12 to 20 percent, so they earn their place in the four peak months and lose to Local Services Ads the rest of the year. Local Services Ads and the Business Profile run all year.
How many leads does an HVAC company need?
Work it back from revenue. The sample company needs 1,250 jobs, 56 percent of them from new leads, at a blended 35 percent close rate, which is about 2,000 new leads a year or 165 a month. Your mix of emergency calls (around 70 percent close) and install shoppers (around 15 percent) moves that number more than any channel does.
Is the HVAC marketing plan template free?
Yes. The Word and PDF versions are in the contractor templates pack, free with your email, with all nine sections filled in for a sample company so you can see how a finished plan reads.